Weiss produces accessible visualizations that simultaneously show you the whole market and key emerging trends. The data and visualizations help you see market vulnerabilities and strengths.
Weissindex.com provides a place to learn about important trends. You can take guided tours or use the Weiss Analytics price forecasts and market views to reach your own conclusion.Weiss Maps
Weiss Maps dynamically illustrate historical and predictive trends, for metros and zip codes, from 18 years in the past to one year into the future. Weiss Maps reveal and forewarn of never before seen trends in markets, often showing waves of value changes moving across a geographic area like a weather event.
Each dot on a map represents one house, with each frame of the animation representing changes in value over a one month period. The dots are color coded, with green indicating increases in value, red indicating decreases, and darker shades indicating faster rates of change relative to lighter shades.
New trends can therefore be discovered, new sub markets defined and ranked, and thus better decisions can be made. Weiss Maps are also available in static format. Both formats are updated monthly with the latest pricing data.
Past and Future
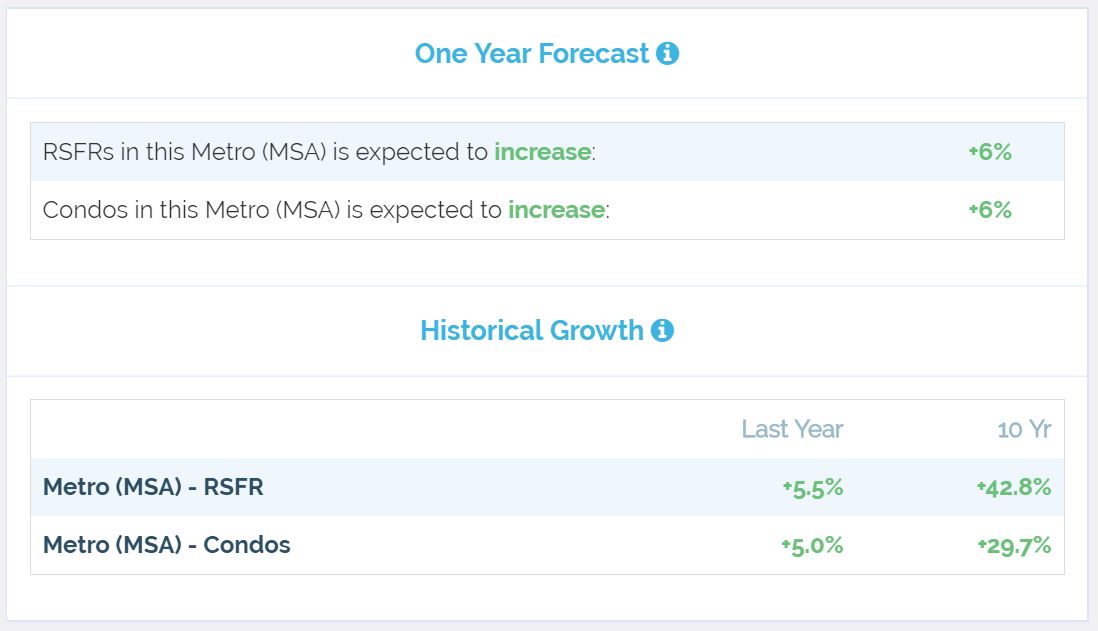
View reports showing historical changes and forecasts. Compare current and future LTV distributions

Interactive Index Tools
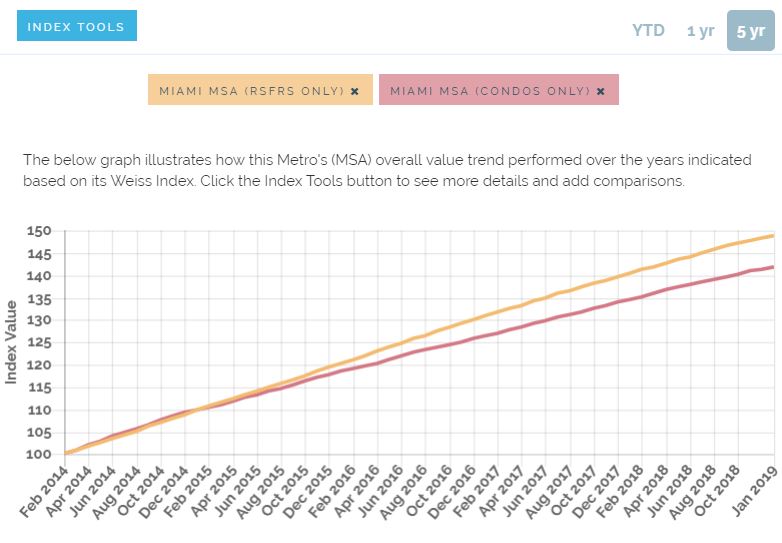
Create reports containing any combination of indexes at the metro, zip and property address level. You can also graph the time series of the percent of homes rising, to highlight shifting market conditions.

Line-by-Line Market Summary
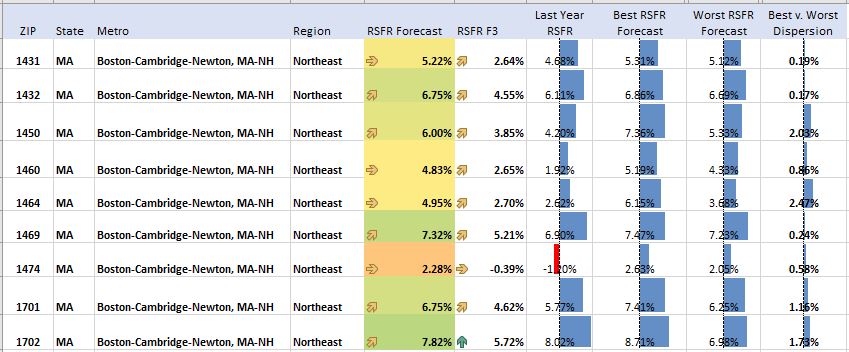
Cube Reports allows user to compare and rank Zip codes within metro areas.

Segmentation Reports
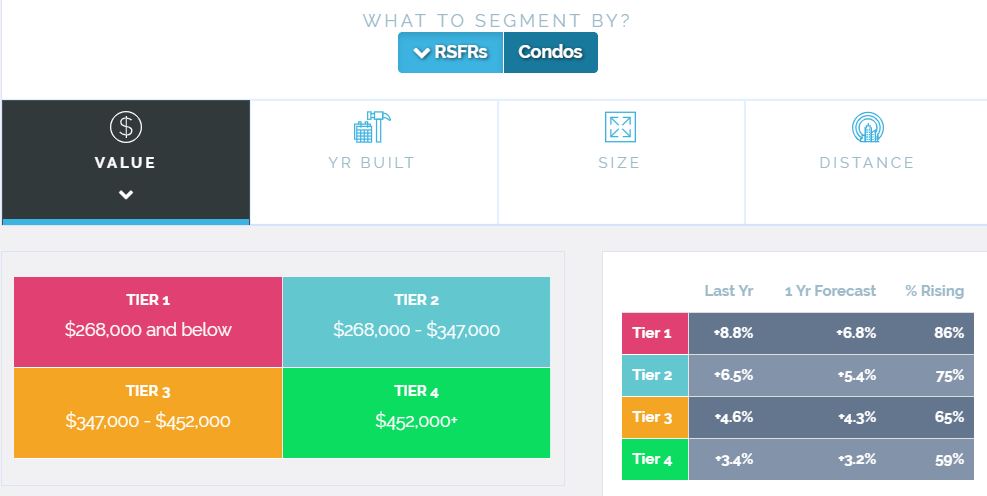
Weiss Segmentation Reports can answer questions like "what to build", "what to buy", or “what to renovate” in a given market. Using these reports, a developer, investor, mortgage company, home buyer, or home owner can determine what kinds of homes are performing the strongest in a defined market and which attributes of a home drive the most value in that area.
